Every database query cost us four round-trips for six months
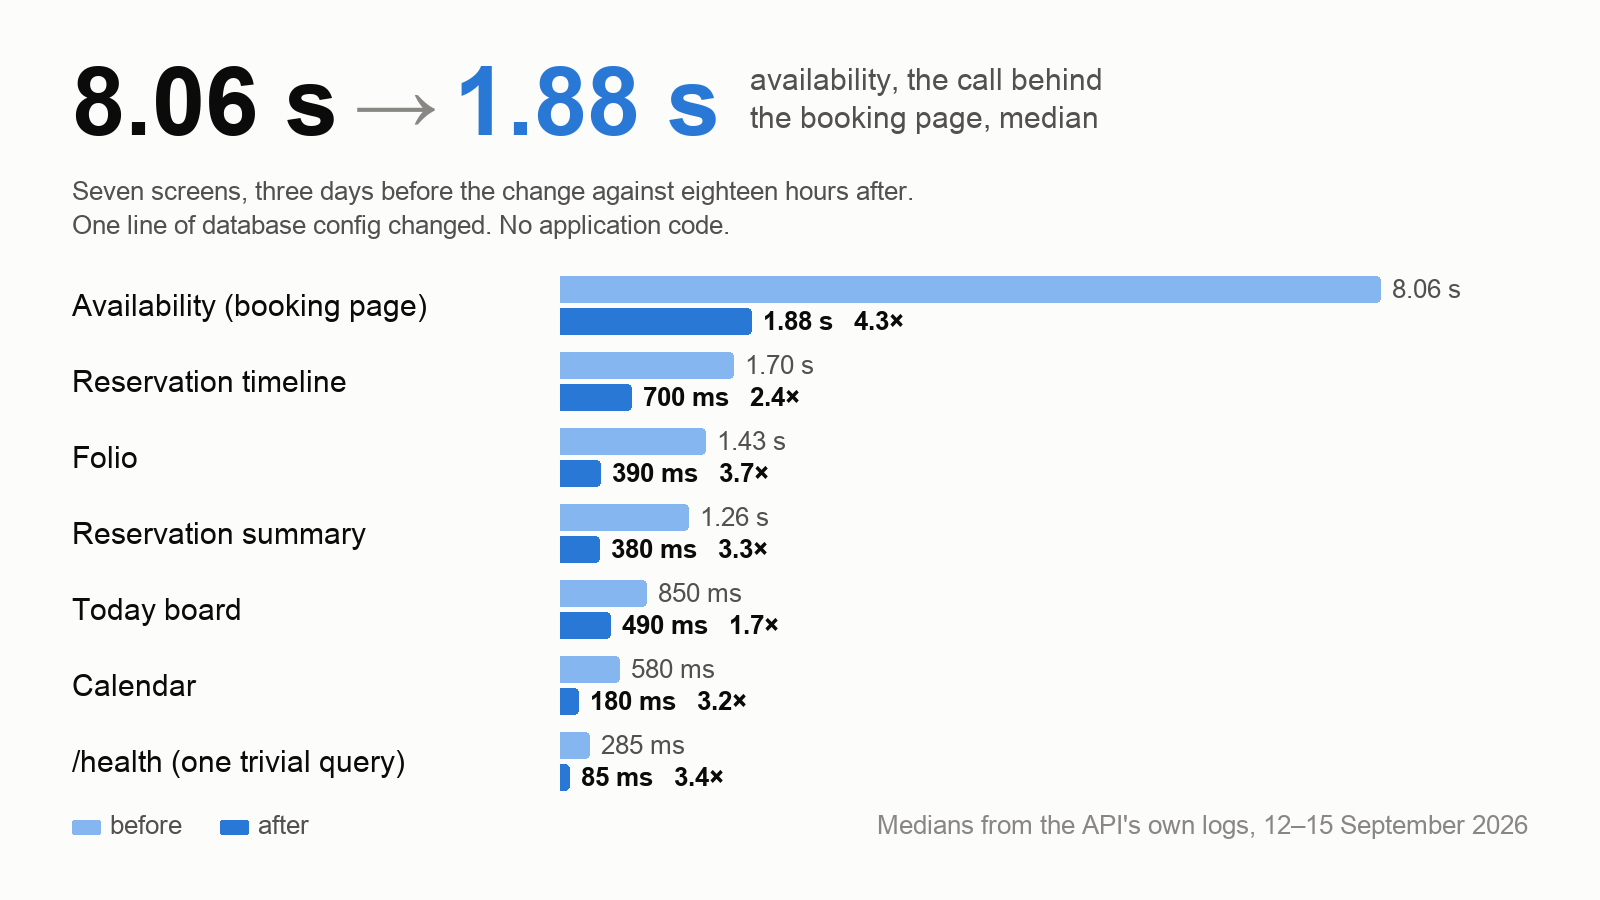
On the evening of 14 September a guest tried to book Mara Hilltop, the lodge I started and run in the Maasai Mara, and every time he chose dates and pressed Continue the page died. That night we fixed the crash and found a separate database configuration mistake we had been living with since March in KaribuKit, the hotel software we build and run the lodge on. Correcting one setting cut the availability check behind the booking page from 8.06 seconds to 1.88. We had measured the cost of that mistake four days after launch, done the arithmetic correctly, and blamed geography.
The crash and the slowness turned out to be unrelated. The crash is the short story; the slowness is the one worth writing down.
The crash
 7:13 PM. He apologised for the screenshot being in Spanish.
Chrome's "page could not be opened" screen is what iOS shows when the browser's content process has been killed twice in a row on the same page, and on a phone that almost always means memory. Our booking page was loading the original camera files for every room photo, and a preloader pulled the full gallery of every room type the moment availability arrived. I downloaded the same 36 files the page fetches and measured them: 47 MB over the wire, 3.9 GB once decoded. The largest, one of the luxury tent interiors, is 8171 by 5957, which is 186 MB on its own. A laptop has the RAM to hide that, which is why I couldn't reproduce it on mine. An iPhone does not, and the tab badge in his original screenshot says 81.
The uncomfortable part is that the fix already existed. Claude Code, Anthropic's command-line coding agent, had written it on 26 August after the same crash on a different page: serve resized copies through the Next.js image optimizer and delete the preloader. It sat in an open pull request for nineteen days because my notes said "PR to dev" and I read that as done. It merged that night and the page went from 36 raw fetches to zero. He had a message saying so at three minutes past midnight. I still don't know whether he booked.
The number that didn't fit
While checking the fixed page I timed the availability request behind it, the call that asks the API which rooms are free for the guest's dates. From the API server itself, on localhost with no network in the way: 9.9 seconds that night, and 8.1 seconds at the median over the previous three days of logs, at 03:00 as much as at 17:00.
The health check was the better clue. /health runs one SELECT 1 against Postgres and pings Redis, and from localhost it took 240 milliseconds the night I measured it, 285 at the median over the three days before. A trivial query should cost about one network round-trip to the database. Our API is a Hetzner box in Helsinki talking to Supabase in Dublin, and that round-trip, measured with a TCP connect from the box, is 47 milliseconds. 240 is four of those with change left over. At that point I didn't know what the four were.
Six months of looking one layer away
We launched on 27 March. On 31 March I wrote a performance spec, because the app was slow, and its first act was to add a Server-Timing header and an X-DB-Queries count to every response. The spec and the baseline captured that day are both still in the repo. The spec records "257 ms TTFB on localhost /health" and files it under "mixed health-check cost". The baseline records the folio endpoint at 2,667 ms of database time against 10 queries, and then, under "Remaining bottleneck", it does the division:
DB round trip: ~267ms per query (2667ms / 10 queries). This is the Hetzner Finland → Supabase Ireland network latency. Every Prisma query pays this cost.
Right arithmetic, wrong sentence. Nobody measured the latency. The recommendation was to move the infrastructure closer, "from ~267ms to ~5ms". That would have worked, in the sense that four round-trips of five milliseconds are cheap, and we would never have learned there were four.
What followed was good work on the wrong layer. We cut the reservation page from 68 requests per load to a handful, cached the user lookup, turned on gzip, added a keepalive when idle tabs came back laggy in May, patched the auth refresh four times in June, and put the API behind Cloudflare in August. Every one of those helped, and none of them touched what a single query cost. "The network is slow" had been the accepted explanation since day four, and every new symptom fit it.
What it actually was
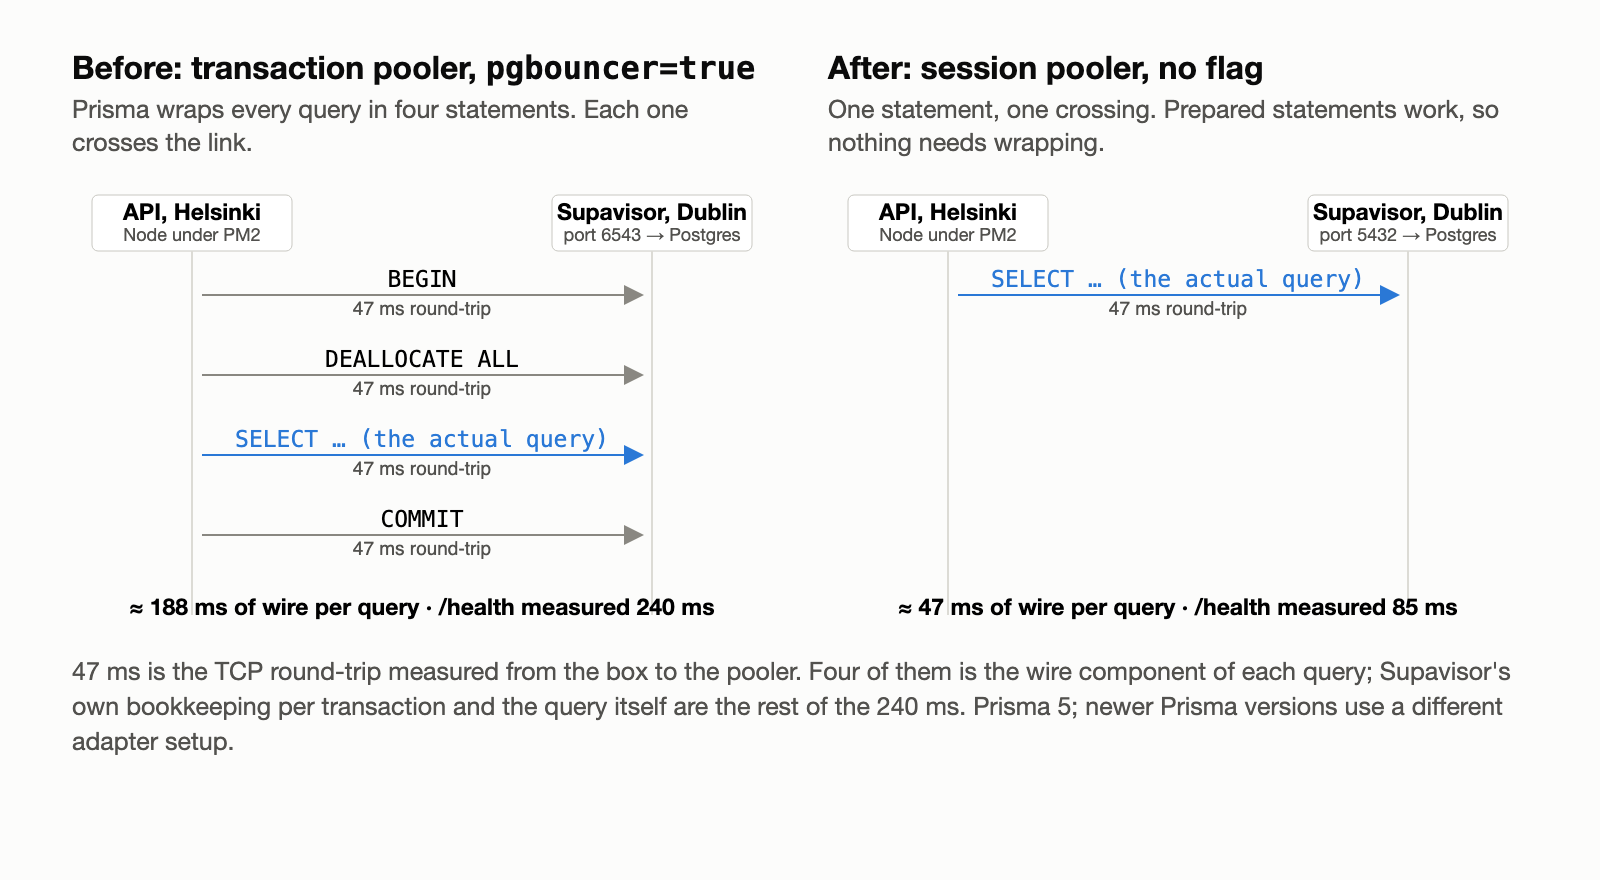 With Prisma 5.22 and
 pgbouncer=true against the transaction pooler, every query made four crossings of the 47 ms link. Session mode makes one.
Supabase puts a pooler called Supavisor in front of Postgres, with two modes. Transaction mode hands a connection to each transaction and can't support prepared statements, so Prisma, our ORM, needs a pgbouncer=true flag to work with it. That flag makes Prisma wrap every query in the four statements in the diagram, and each one crosses the link: 188 of the 240 milliseconds the health check was costing, with the pooler's own bookkeeping and the query itself as the rest. On a pooler in the same rack the wrapping costs a few milliseconds. Across the 47 milliseconds between Helsinki and Dublin, the measured cost per query on the availability path came out between 210 and 260 milliseconds, on every query the application makes.
The database had been keeping score since March. pg_stat_statements showed BEGIN at 4,053,716 calls, DEALLOCATE ALL at 4,053,574 and COMMIT at 4,053,080, against roughly four million real queries. The total server-side time for all four million DEALLOCATE ALL calls was 9.6 seconds. The database was doing nothing; the time was all wire. The availability endpoint asks 38 questions in a row, most of them per room type (is a room free, what's the rate, any overrides for these dates), and at a quarter of a second each that is the ten seconds.
Session mode pins a backend to the client connection, supports prepared statements, and needs no flag. Its only cost is that every open connection holds a pool slot, so the pool has to be sized on purpose. Supabase's own Prisma guide puts long-running servers on session mode; the transaction-mode recipe with the flag is for serverless functions that open a connection per request. KaribuKit is a Node process that lives for weeks under PM2. We had copied the serverless recipe in launch week and never looked at it again, partly because it lived only in a .env file on the server.
The fix, and how we knew it worked
One line. DATABASE_URL moved from port 6543 with pgbouncer=true to port 5432 with connection_limit=5, on staging first and then on production at 23:40 Nairobi time, with a rollback that takes a minute. Availability went from 8.06 s to 1.88 s at the median, the folio from 1.43 to 0.39, the calendar from 0.58 to 0.18, /health from 285 ms to 85, and the today board only 0.85 to 0.49. Most screens three to four times faster, the booking page 4.3, the today board 1.7.
Speed alone isn't proof, because a half-applied change (one of two processes restarted, one of two config files edited) is also faster. What convinced me was the mechanism's own counter: two samples of pg_stat_statements a couple of minutes apart with known requests in between, and DEALLOCATE ALL did not move, which is 38 statements per availability request down to zero. ss -tnp put every API and worker socket on port 5432 to Dublin and none on 6543, and a twelve-way concurrent burst against a pool of five held without a timeout.
Who found it
I didn't. I gave Claude Code the guest's screenshot and asked whether the problem was ours or his phone's. It answered that in twenty minutes and, while verifying the deploy, noticed the ten-second floor and kept pulling: the logs by hour, the 47 ms TCP measurement, the pg_stat_statements query, the arithmetic. A second session, running on the server, then refused to run my config-change procedure as written, because the process names in it were wrong and one sequence of commands would have pointed production at the staging database while every check reported green. Four revisions later it ran.
The part I'm least comfortable with is that the same kind of tooling helped write the March baseline that divided 2,667 by 10, called the answer the distance to Ireland, and proposed moving continents. The arithmetic in an agent's analysis is usually right. The sentence it attaches to the result is a guess until something measured stands behind it, and I read both with the same confidence.
What I now believe
- A cost that doesn't scale with payload, nights or load is per-call overhead, not slow work. Availability took ten seconds for one night and ten seconds for seven.
- The third patch on the same symptom is the signal to re-measure from scratch instead of patching again.
- Anything load-bearing that only exists in server config gets its shape written in the repo, with the reason, or the next password rotation puts it back.
The check, on any stack with a remote database:
- On the API host, time the health check:
curl -s -o /dev/null -w '%{time_starttransfer}\n' http://localhost:PORT/health, where the health check does one trivial query. - Measure the TCP round-trip from that host to the database endpoint.
- If the first number is more than about twice the second, find out what your driver does per query.
Ours read 240 against 47 from the first week. Next for us is fanning the availability handler's 38 questions out in parallel, which should put it under a second. If your localhost health check reads a few hundred milliseconds against a ping of tens, that's a reason to look at the driver, not proof it's the same cause. Either way I'd like to hear which recipe you copied: nj@simbastack.com.
— NJ
I run SimbaStack, where we build AI agents and the systems they work in, and KaribuKit, the hotel software in this story. If you need help getting an agent into production, tell me what you're building, same address.